Compute breaks for ratio scale
breaks_divMult.RdCompute breaks for ratio scale
Usage
breaks_divMult(n = 6, nmin = 5, anchor = TRUE, splits = 5, base = exp(1))Arguments
- n
Scalar, target number of breaks
- nmin
Scalar, forced minimum number of breaks
- anchor
NULL or scalar, value to include as a reference point (usually 1)
- splits
Integer, one of
c(1,2,3). How many tick marks per "decade?"- base
a positive or complex number: the base with respect to which logarithms are computed. Defaults to \(e\)=
exp(1).
See also
Other breaking:
limit_breaks(),
limitimil(),
split_decades()
Examples
y <- exp(seq(-2,5, length.out = 10))
v <- log(y) # log data or data range
n <- 5
# axisTicks takes giant steps, returns values way beyond data
grDevices::axisTicks(nint = n, log = TRUE, usr = range(v))
#> [1] 1e-02 1e-01 1e+00 1e+01 1e+02 1e+03 1e+04 1e+05
# breaks_divMult gives ~n breaks evenly within the data
breaks_divMult(n = n)(v = y)
#> [1] 0.1 0.2 0.5 1.0 1.6 2.5 4.0 6.4 10.0 16.0 25.0 40.0
#> [13] 64.0 100.0 160.0
# if 1 is lower limit, only positive log(breaks)
breaks_divMult()(c(1, 11))
#> [1] 1 2 5 10 20
# ditto, only negative log(breaks) if 1 is upper limit
breaks_divMult()(c(0.04, 1))
#> [1] 1.00 0.20 0.10 0.02
# expanding range on one side of 1 doesn't leave the other side behind
breaks_divMult()(c(0.04, 2.2))
#> [1] 0.02 0.10 0.20 1.00 2.00 3.00
breaks_divMult()(c(0.04, 220))
#> [1] 0.02 0.10 0.20 1.00 1.60 2.50 4.00 6.40 10.00 16.00
#> [11] 25.00 40.00 64.00 100.00 160.00 250.00
breaks_divMult()(c(0.04, 2200))
#> [1] 0.02 0.10 0.20 1.00 1.60 2.50 4.00 6.40 10.00
#> [10] 16.00 25.00 40.00 64.00 100.00 160.00 250.00 400.00 640.00
#> [19] 1000.00 1600.00 2500.00
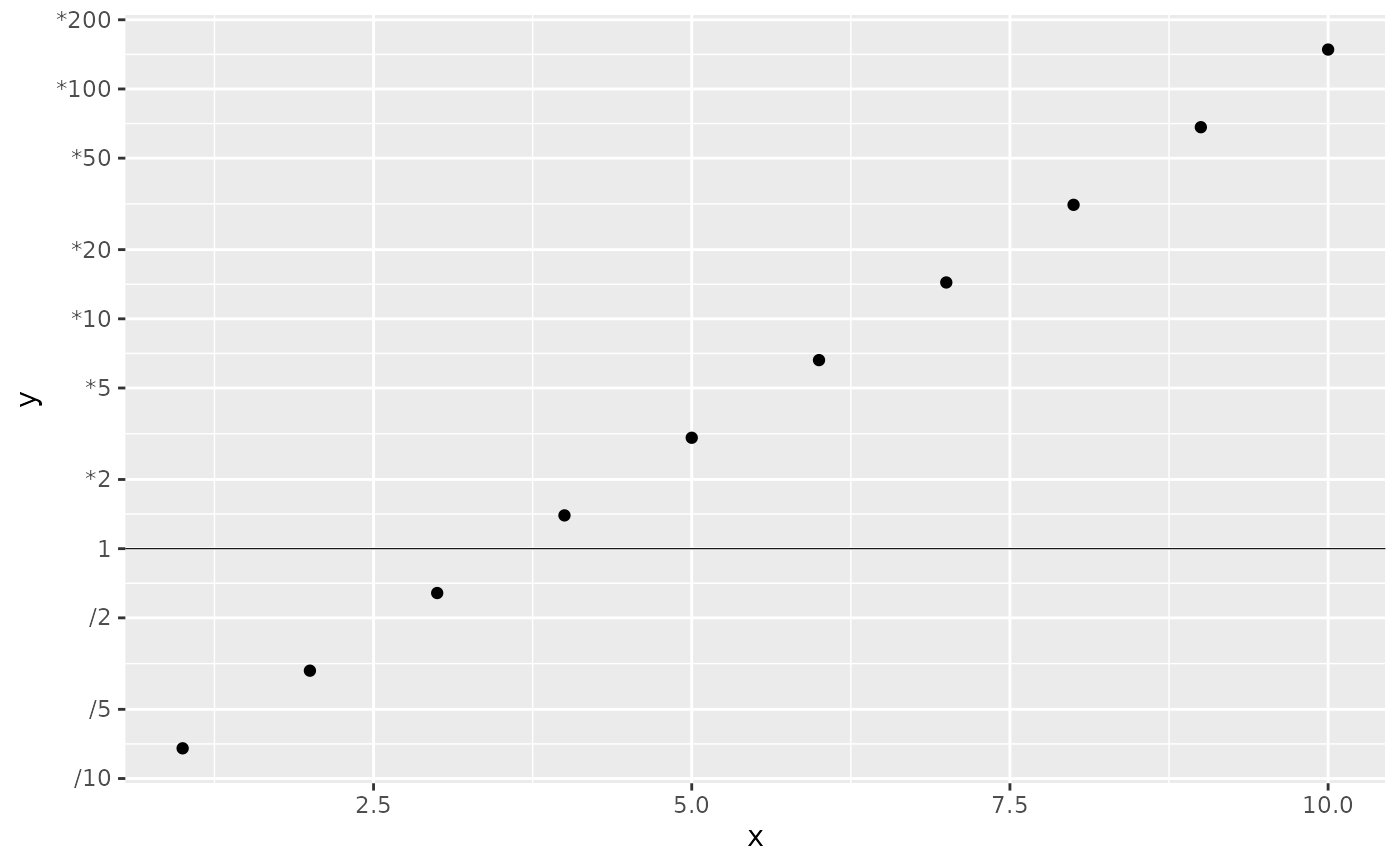
x <- 1:10
dat <- data.frame(x, y)
dat %>% ggplot2::ggplot(ggplot2::aes(x, y))+
ggplot2::geom_point()+
ggplot2::geom_hline(yintercept = 1, linewidth = 0.2) +
ggplot2::scale_y_continuous(
transform = "log"
, breaks = breaks_divMult()
, labels = label_divMult()
)
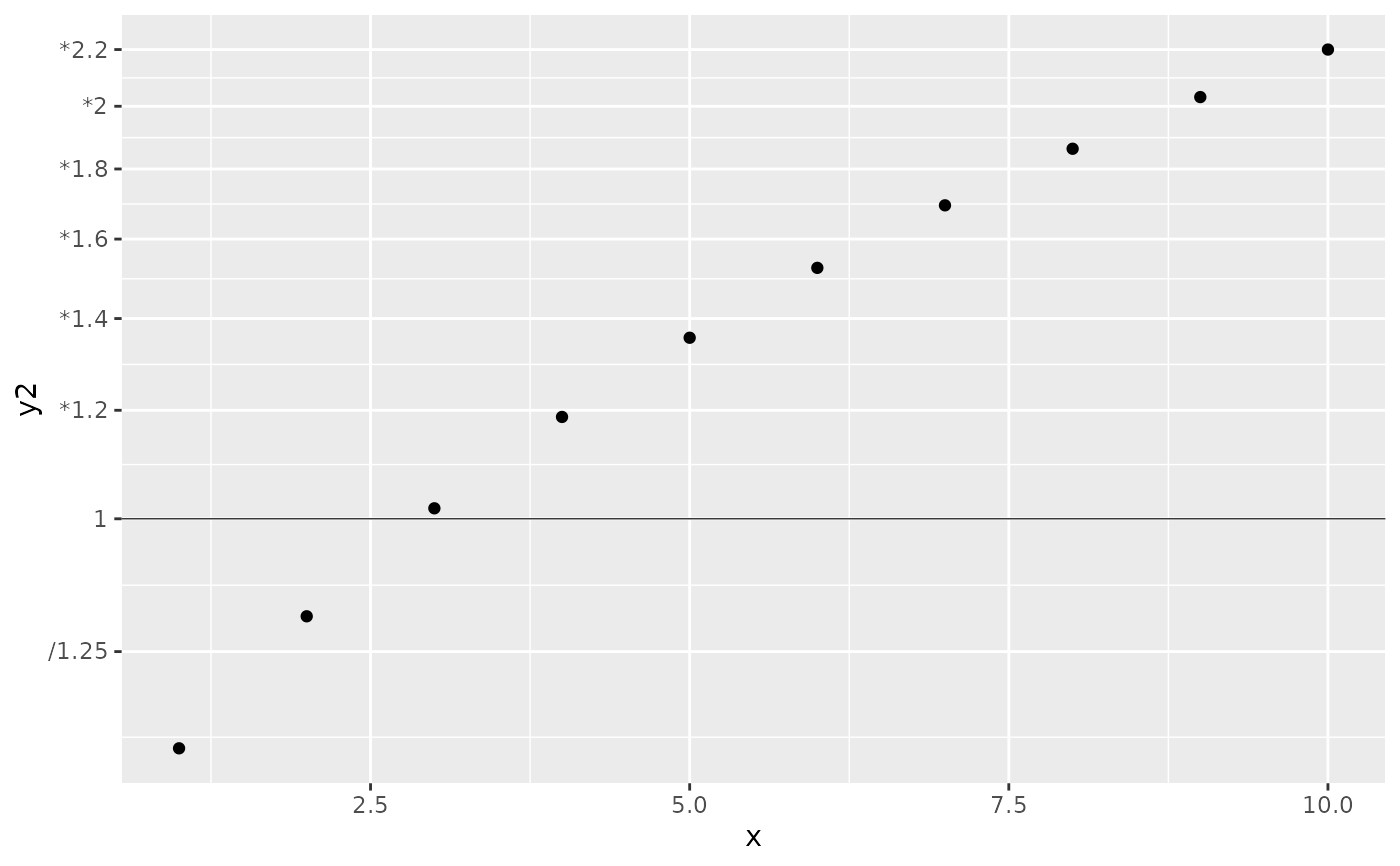
 # custom breaks might still be needed when y-range is small
y2 <- seq(0.68, 2.2, length.out = 10)
dat2 <- data.frame(x, y2)
dat2 %>% ggplot2::ggplot(ggplot2::aes(x, y2))+
ggplot2::geom_point()+
ggplot2::geom_hline(yintercept = 1, linewidth = 0.2) +
ggplot2::scale_y_continuous(
transform = "log"
# , breaks = breaks_divMult()
, breaks = c(seq(0.4, 2.2, by = 0.2))
, labels = label_divMult()
)
# custom breaks might still be needed when y-range is small
y2 <- seq(0.68, 2.2, length.out = 10)
dat2 <- data.frame(x, y2)
dat2 %>% ggplot2::ggplot(ggplot2::aes(x, y2))+
ggplot2::geom_point()+
ggplot2::geom_hline(yintercept = 1, linewidth = 0.2) +
ggplot2::scale_y_continuous(
transform = "log"
# , breaks = breaks_divMult()
, breaks = c(seq(0.4, 2.2, by = 0.2))
, labels = label_divMult()
)