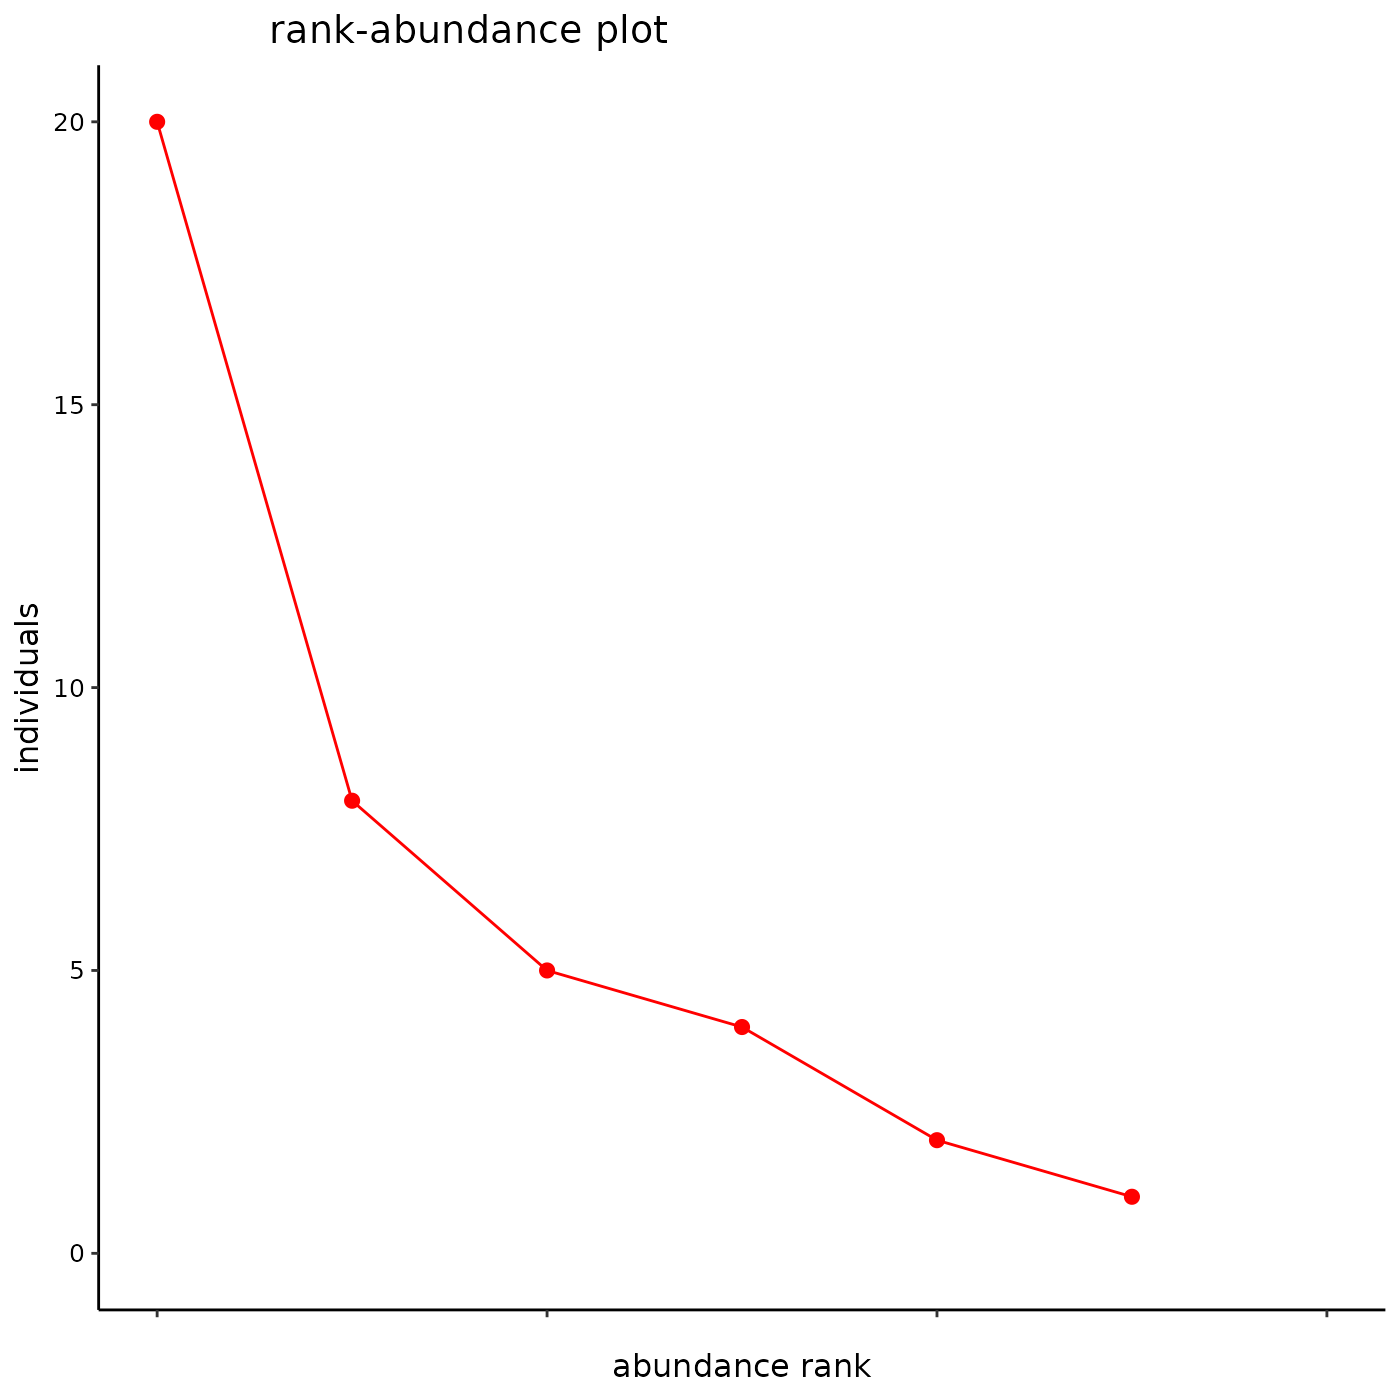
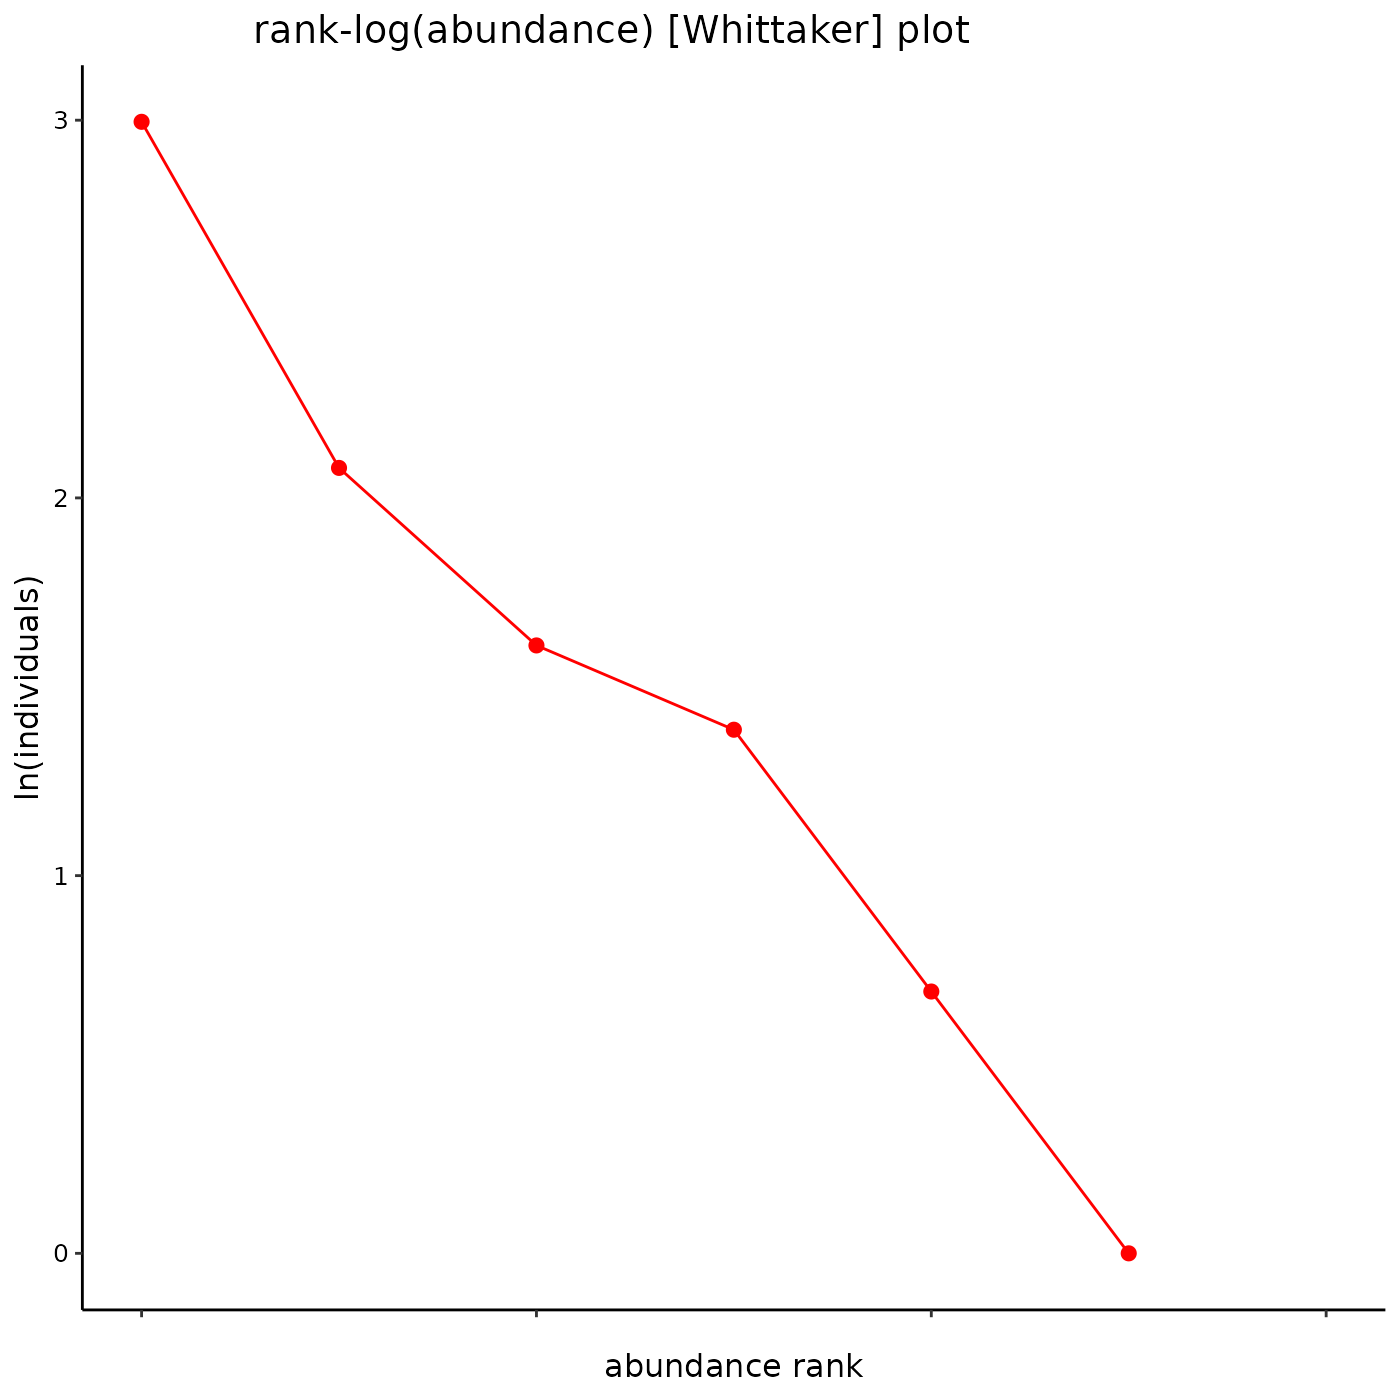
Plot a rank-abundance distribution
radplot.RdTake a vector of species [relative] abundances and plot a rank-abundance distribution or Whittaker plot.
Arguments
- ab
A numeric vector of species abundances or relative abundances.
- maxrich
Scalar, how many species to include space for
- maxab
Scalar, how big is the largest abundance value
- fill
Character string specifying a color, could be extended to permit name for community ID variable
- shape
Character string for point shape, could be extended to permit name for community ID variable
- size
Scalar, adjusts point size in ggplot object
- Whittaker
Logical, if
TRUElog-transform abundances
Value
ggplot object with a rank-abundance plot

