ggplot sugar for rarity plots
seesaw_sugar.Rdggplot sugar for rarity plots
seesaw_sugar(title = NULL, l, unicode_in_title = TRUE, ...)Arguments
- title
Character string, or NULL.
- l
Scaling exponent for the mean, can be any real number.
- unicode_in_title
Logical, include unicode ell and its value.
- ...
Additional arguments passed to other functions.
Value
ggplot objects to add to rarity plot
Examples
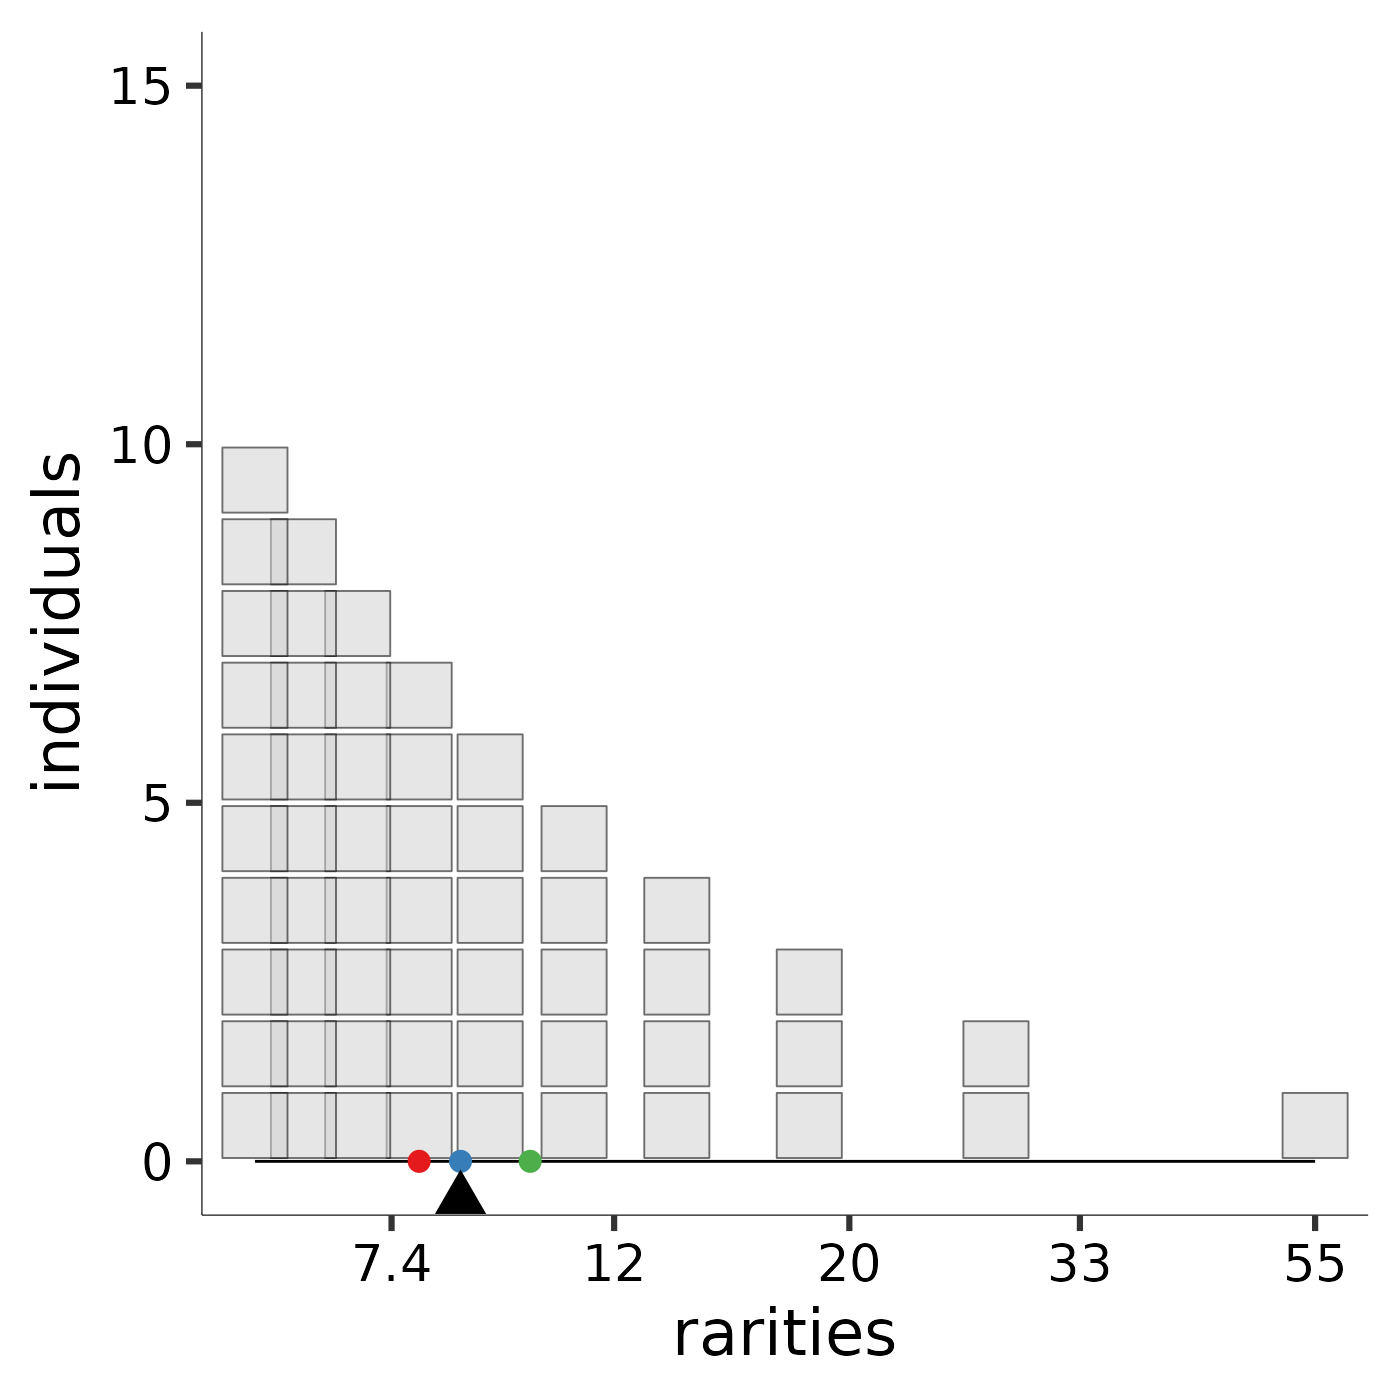
p1 <- rarity_plot(1:10, l = 0)
#>
#>      `rarity_plot()` expects a square viewport (likely issues in the RStudio
#>      plotting device) and resizes points based on `min(dev.size()` and ``noco`
#>      (for number of columns).
#>
#>      Selecting `lines = TRUE` will plot stacks of individuals as a line
#>      element, which tends to be more robust to window size.
#>
#>      Setting `lines = TRUE` may be the best way to deal with overplotting,
#>      which results from several species with similar but not identical
#>      rarities.
#> [1] "diversity = 8.59586884212865" "community size = 55"
#> [3] "max observed rarity = 55"     "min observed rarity = 5.5"
p1

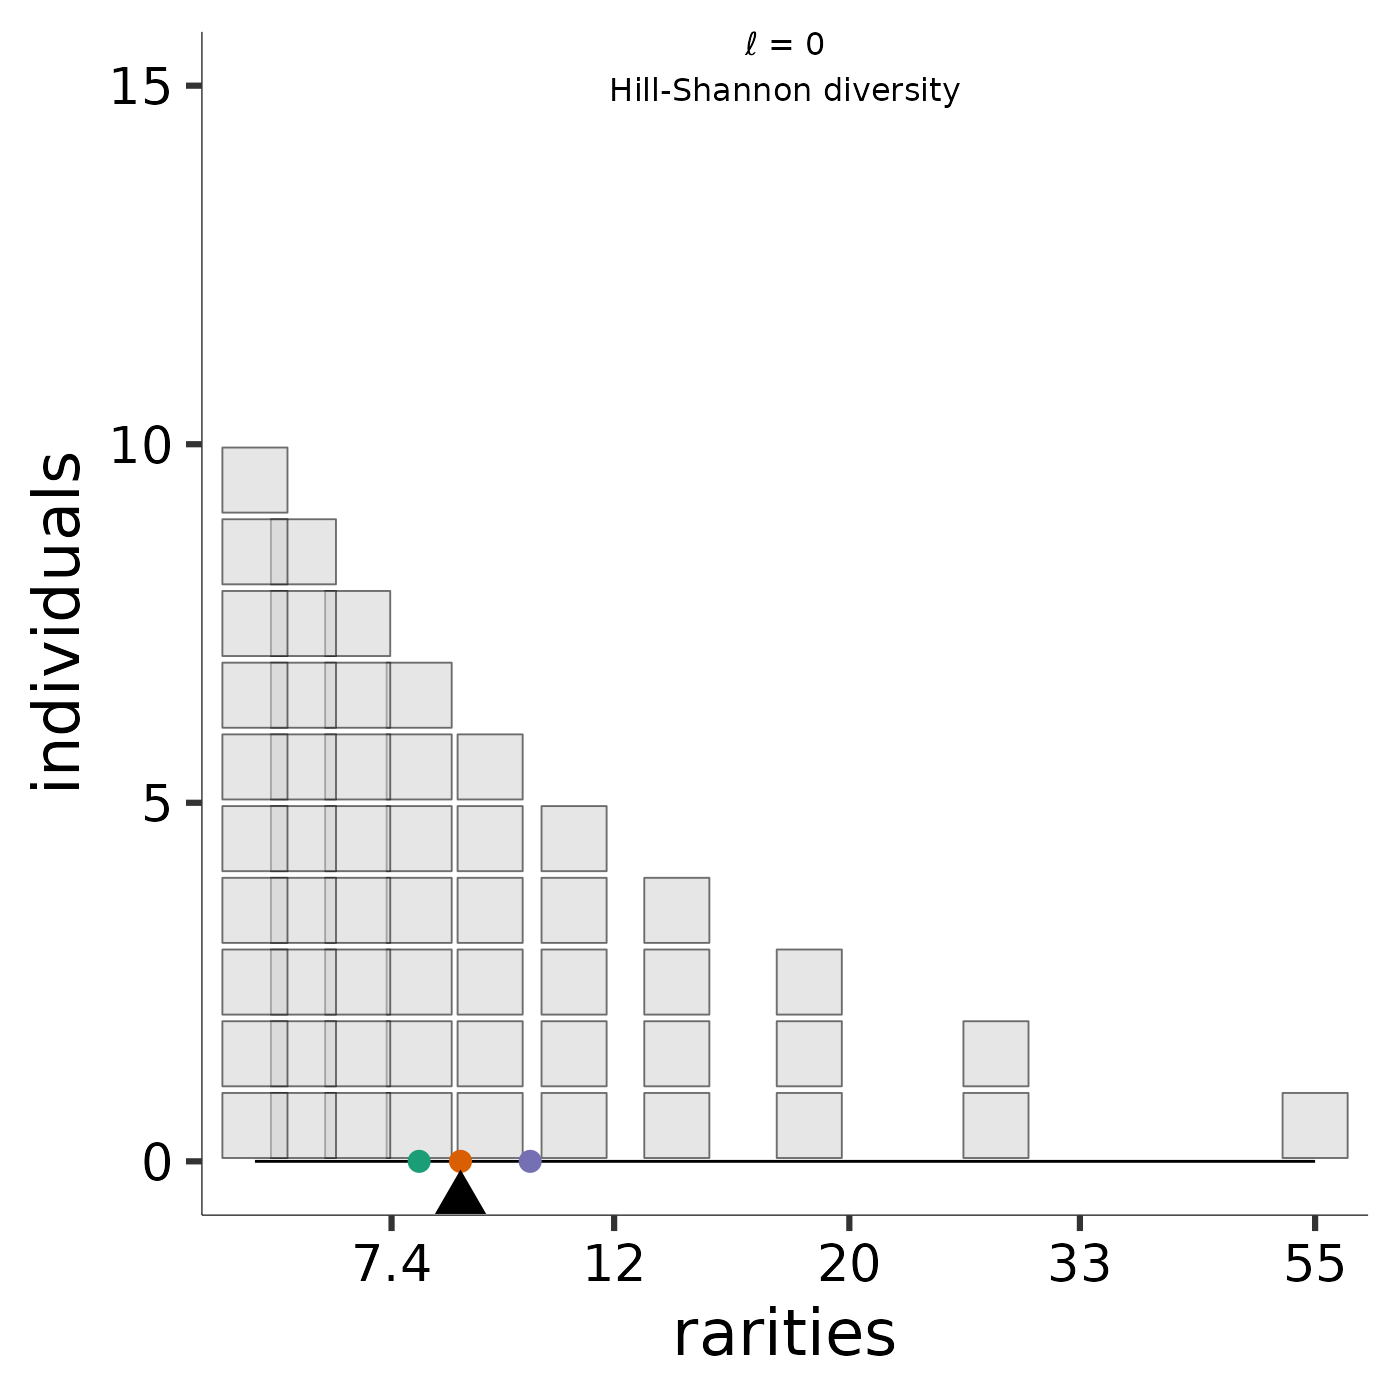
p1 + seesaw_sugar(title = "Hill-Shannon diversity"
  , l = 0)
#> Scale for colour is already present.
#> Adding another scale for colour, which will replace the existing scale.
